 Catalogue PIGMA
IEO/ Gijon Oceanographic Centre
Type of resources
Available actions
Topics
Keywords
Contact for the resource
Provided by
Years
Formats
Representation types
Resolution
-
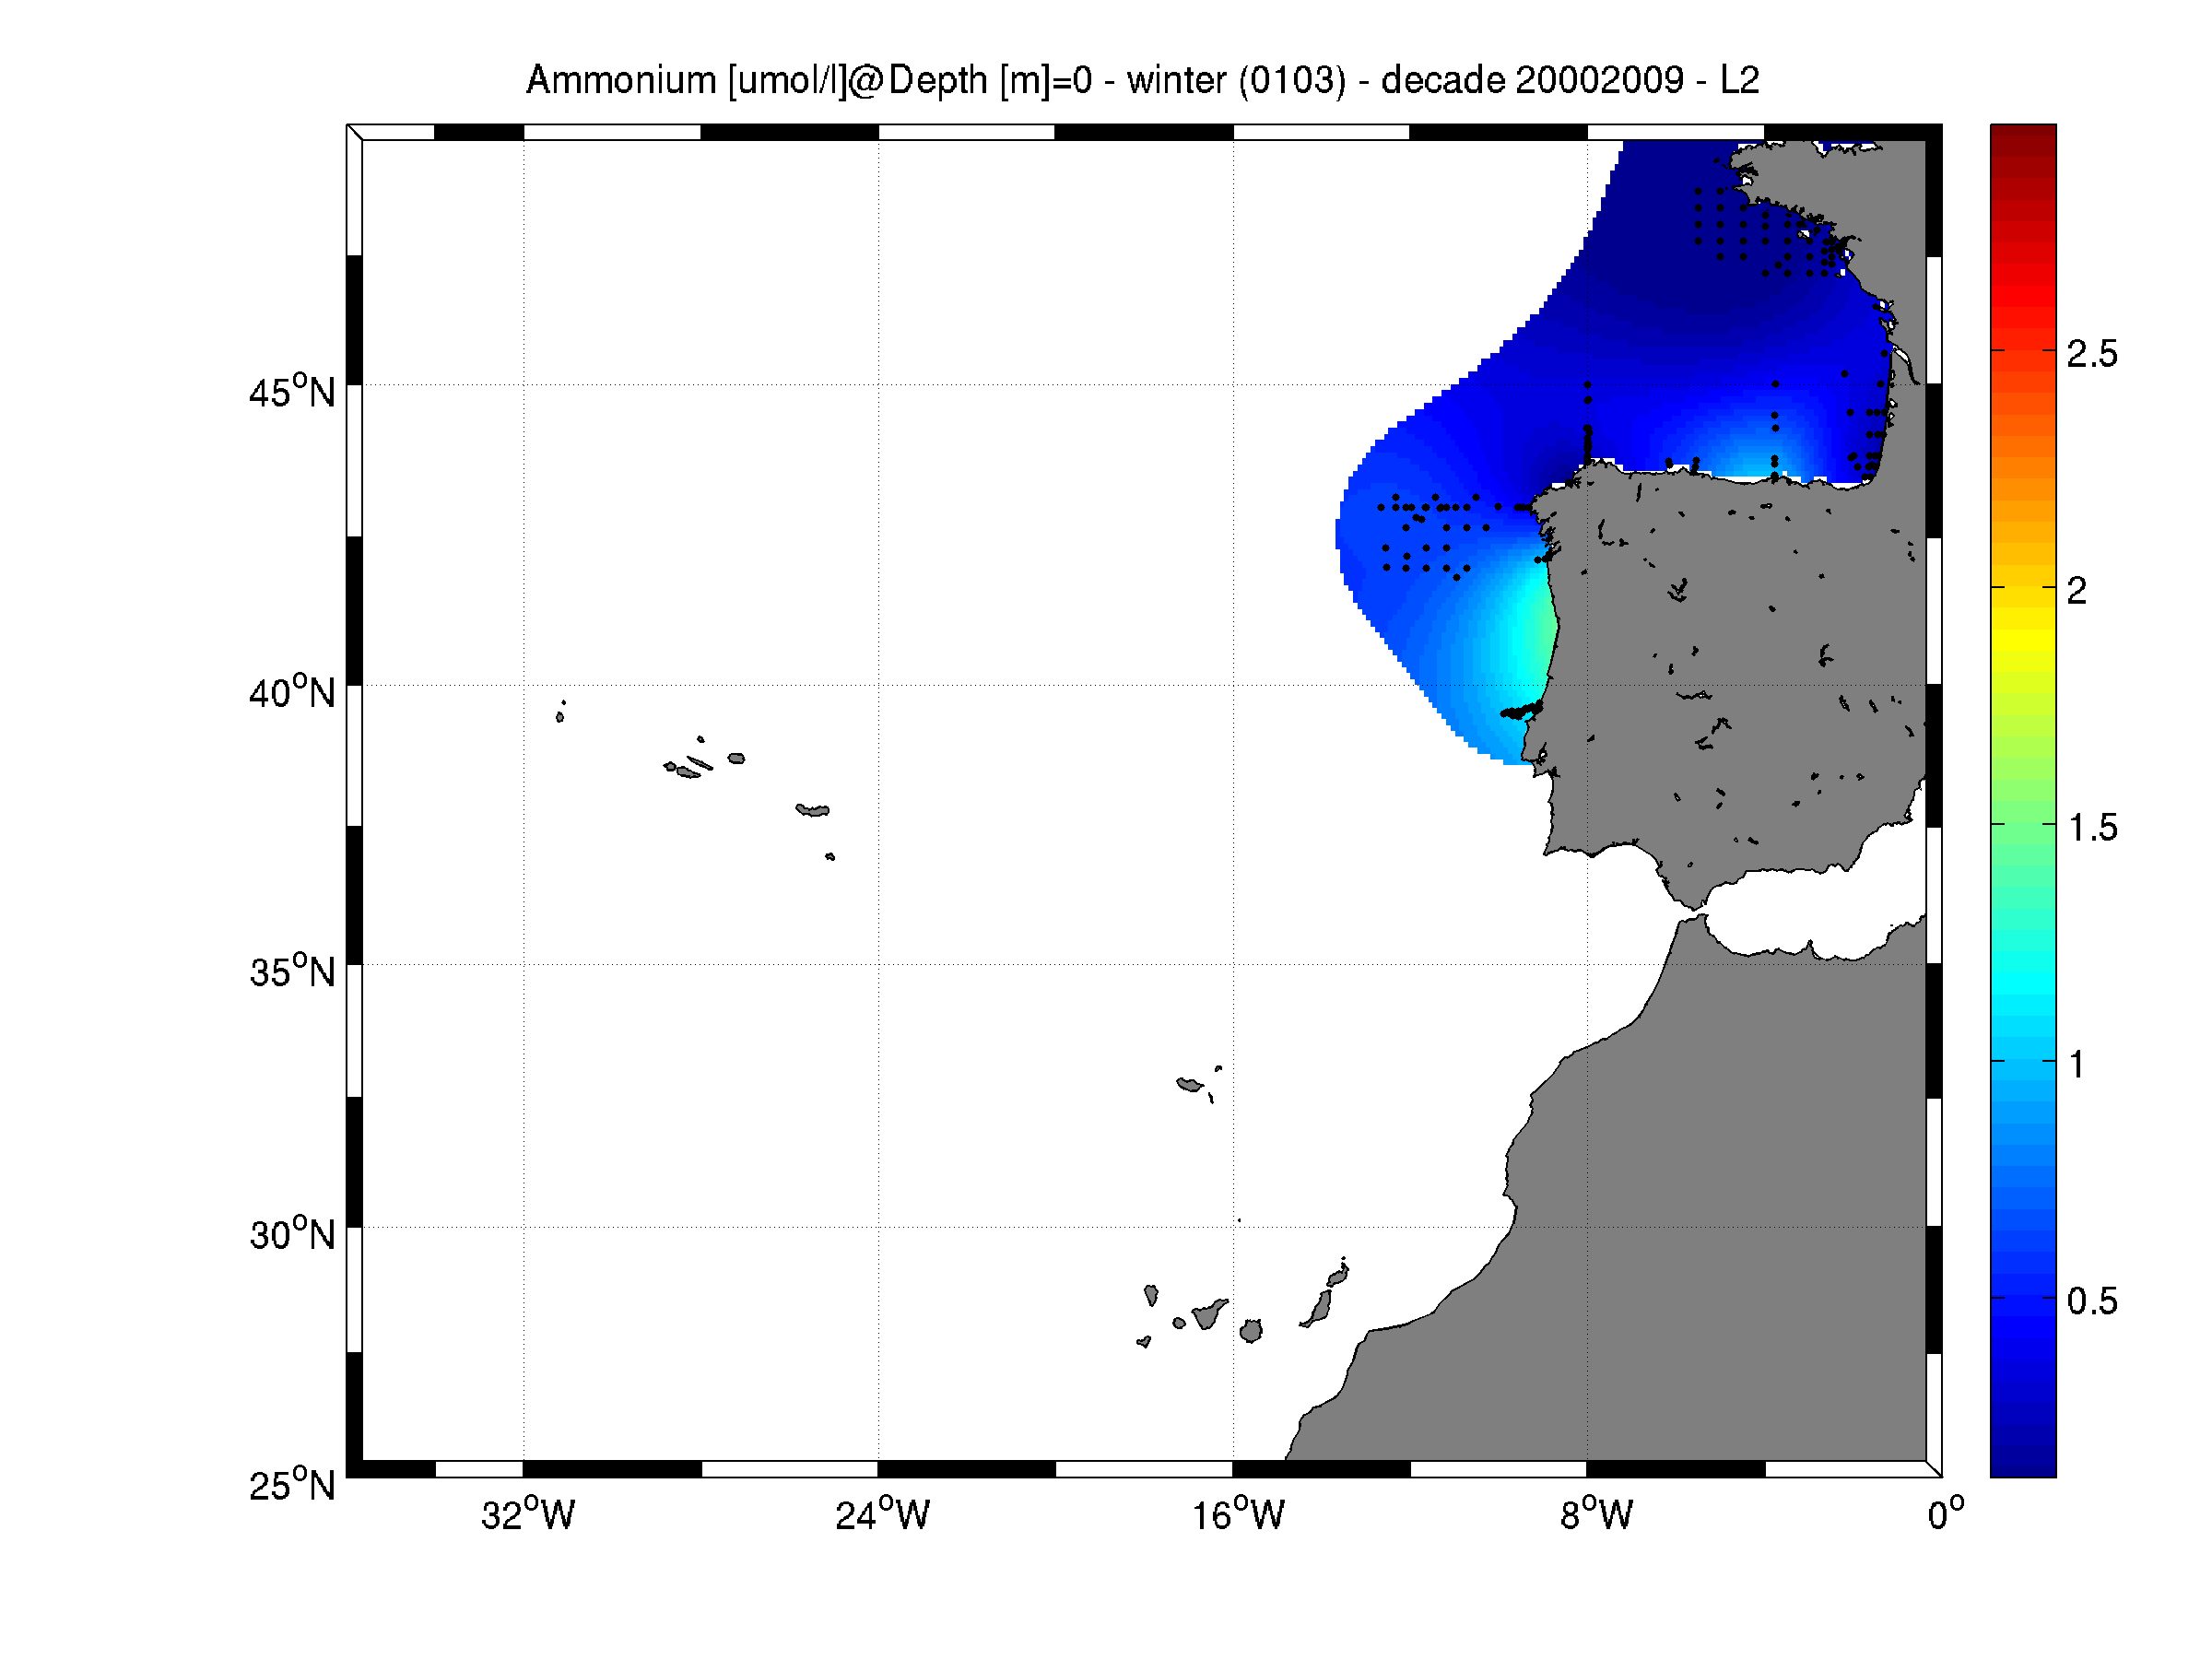
Moving 10-years analysis of Ammonium at Northeast Atlantic Ocean for each season: - winter: January-March, - spring: April-June, - summer: July-September, - autumn: October-December. Every year of the time dimension corresponds to the 10-year centred average of each season. Decades span : - from 1984-1993 until 2005-2014 (winter) - from 1980-1989 until 2005-2014 (spring) - from 1980-1989 until 2005-2014 (summer) - from 1980-1989 until 2005-2014 (autumn) Observational data span from 1962 to 2014. Depth range (IODE standard depths): -3000.0, -2500.0, -2000.0, -1750, -1500.0, -1400.0, -1300.0, -1200.0, -1100.0, -1000.0, -900.0, -800.0, -700.0, -600.0, -500.0, -400.0, -300.0, -250.0, -200.0, -150.0, -125.0, -100.0, -75.0, -50.0,-40.0, -30.0, -20.0, -10.0, -5.0, -0.0 Data Sources: observational data from SeaDataNet/EMODNet Chemistry Data Network. Description of DIVA analysis: Geostatistical data analysis by DIVA (Data-Interpolating Variational Analysis) tool. GEBCO 1min topography is used for the contouring preparation. Analyzed filed masked using relative error threshold 0.3 and 0.5 DIVA settings. Signal to noise ratio and correlation length were optimized and filtered vertically and a seasonally-averaged profile was used. Logarithmic transformation applied to the data prior to the analysis. Background field: the data mean value is subtracted from the data. Detrending of data: no, Advection constraint applied: no. Units: umol/l
-
Moving 10-years analysis of Silicate at Northeast Atlantic Ocean for each season. - winter: January-March, - spring: April-June, - summer: July-September, - autumn: October-December Every year of the time dimension corresponds to the 10-year centred average of each season. Decades span - from 1963-1972 until 2005-2014 (winter) - from 1979-1988 until 2005-2014 (spring) - from 1990-1999 until 2005-2014 (summer) - from 1964-1973 until 2005-2014 (autumn) Observational data span from 1962 to 2014. Depth range (IODE standard depths): -3000.0, -2500.0, -2000.0, -1750, -1500.0, -1400.0, -1300.0, -1200.0, -1100.0, -1000.0, -900.0, -800.0, -700.0, -600.0, -500.0, -400.0, -300.0, -250.0, -200.0, -150.0, -125.0, -100.0, -75.0, -50.0,-40.0, -30.0, -20.0, -10.0, -5.0, -0.0 Data Sources: observational data from SeaDataNet/EMODNet Chemistry Data Network. Description of DIVA analysis: Geostatistical data analysis by DIVA (Data-Interpolating Variational Analysis) tool. GEBCO 1min topography is used for the contouring preparation. Analyzed filed masked using relative error threshold 0.3 and 0.5 DIVA settings. Signal to noise ratio and correlation length were optimized and filtered vertically and a seasonally-averaged profile was used. Logarithmic transformation applied to the data prior to the analysis. Background field: the data mean value is subtracted from the data. Detrending of data: no, Advection consraint applied: no. Units: umol/l
-
Moving 10-years analysis of nitrate plus nitrite at Northeast Atlantic Ocean for each season: - winter: January-March, - spring: April-June, - summer: July-September, - autumn: October-December. Every year of the time dimension corresponds to the 10-year centred average of each season. Decades span : - from 1984-1993 until 2005-2014 (winter) - from 1979-1988 until 2005-2014 (spring) - from 1982-1991 until 2005-2014 (summer) - from 1972-1981 until 2005-2014 (autumn) Observational data span from 1962 to 2014. Depth range (IODE standard depths): -3000.0, -2500.0, -2000.0, -1750, -1500.0, -1400.0, -1300.0, -1200.0, -1100.0, -1000.0, -900.0, -800.0, -700.0, -600.0, -500.0, -400.0, -300.0, -250.0, -200.0, -150.0, -125.0, -100.0, -75.0, -50.0,-40.0, -30.0, -20.0, -10.0, -5.0, -0.0 Data Sources: observational data from SeaDataNet/EMODNet Chemistry Data Network. Description of DIVA analysis: Geostatistical data analysis by DIVA (Data-Interpolating Variational Analysis) tool. GEBCO 1min topography is used for the contouring preparation. Analyzed filed masked using relative error threshold 0.3 and 0.5 DIVA settings. Signal to noise ratio and correlation length were optimized and filtered vertically and a seasonally-averaged profile was used. Logarithmic transformation applied to the data prior to the analysis. Background field: the data mean value is subtracted from the data. Detrending of data: no, Advection consraint applied: no. Units: umol/l
-
Moving 10-years analysis of Phosphate at Northeast Atlantic Ocean for each season: - winter: January-March, - spring: April-June, - summer: July-September, - autumn: October-December Every year of the time dimension corresponds to the 10-year centred average of each season. Decades span : - from 1963-1972 until 2005-2014 (winter) - from 1963-1972 until 2005-2014 (spring) - from 1964-1973 until 2005-2014 (summer) - from 1964-1973 until 2005-2014 (autumn) Observational data span from 1962 to 2014. Depth range (IODE standard depths): -3000.0, -2500.0, -2000.0, -1750, -1500.0, -1400.0, -1300.0, -1200.0, -1100.0, -1000.0, -900.0, -800.0, -700.0, -600.0, -500.0, -400.0, -300.0, -250.0, -200.0, -150.0, -125.0, -100.0, -75.0, -50.0,-40.0, -30.0, -20.0, -10.0, -5.0, -0.0 Data Sources: observational data from SeaDataNet/EMODNet Chemistry Data Network. Description of DIVA analysis: Geostatistical data analysis by DIVA (Data-Interpolating Variational Analysis) tool. GEBCO 1min topography is used for the contouring preparation. Analyzed filed masked using relative error threshold 0.3 and 0.5 DIVA settings. Signal to noise ratio and correlation length were optimized and filtered vertically and a seasonally-averaged profile was used. Logarithmic transformation applied to the data prior to the analysis. Background field: the data mean value is subtracted from the data. Detrending of data: no, Advection constraint applied: no. Units: umol/l
-
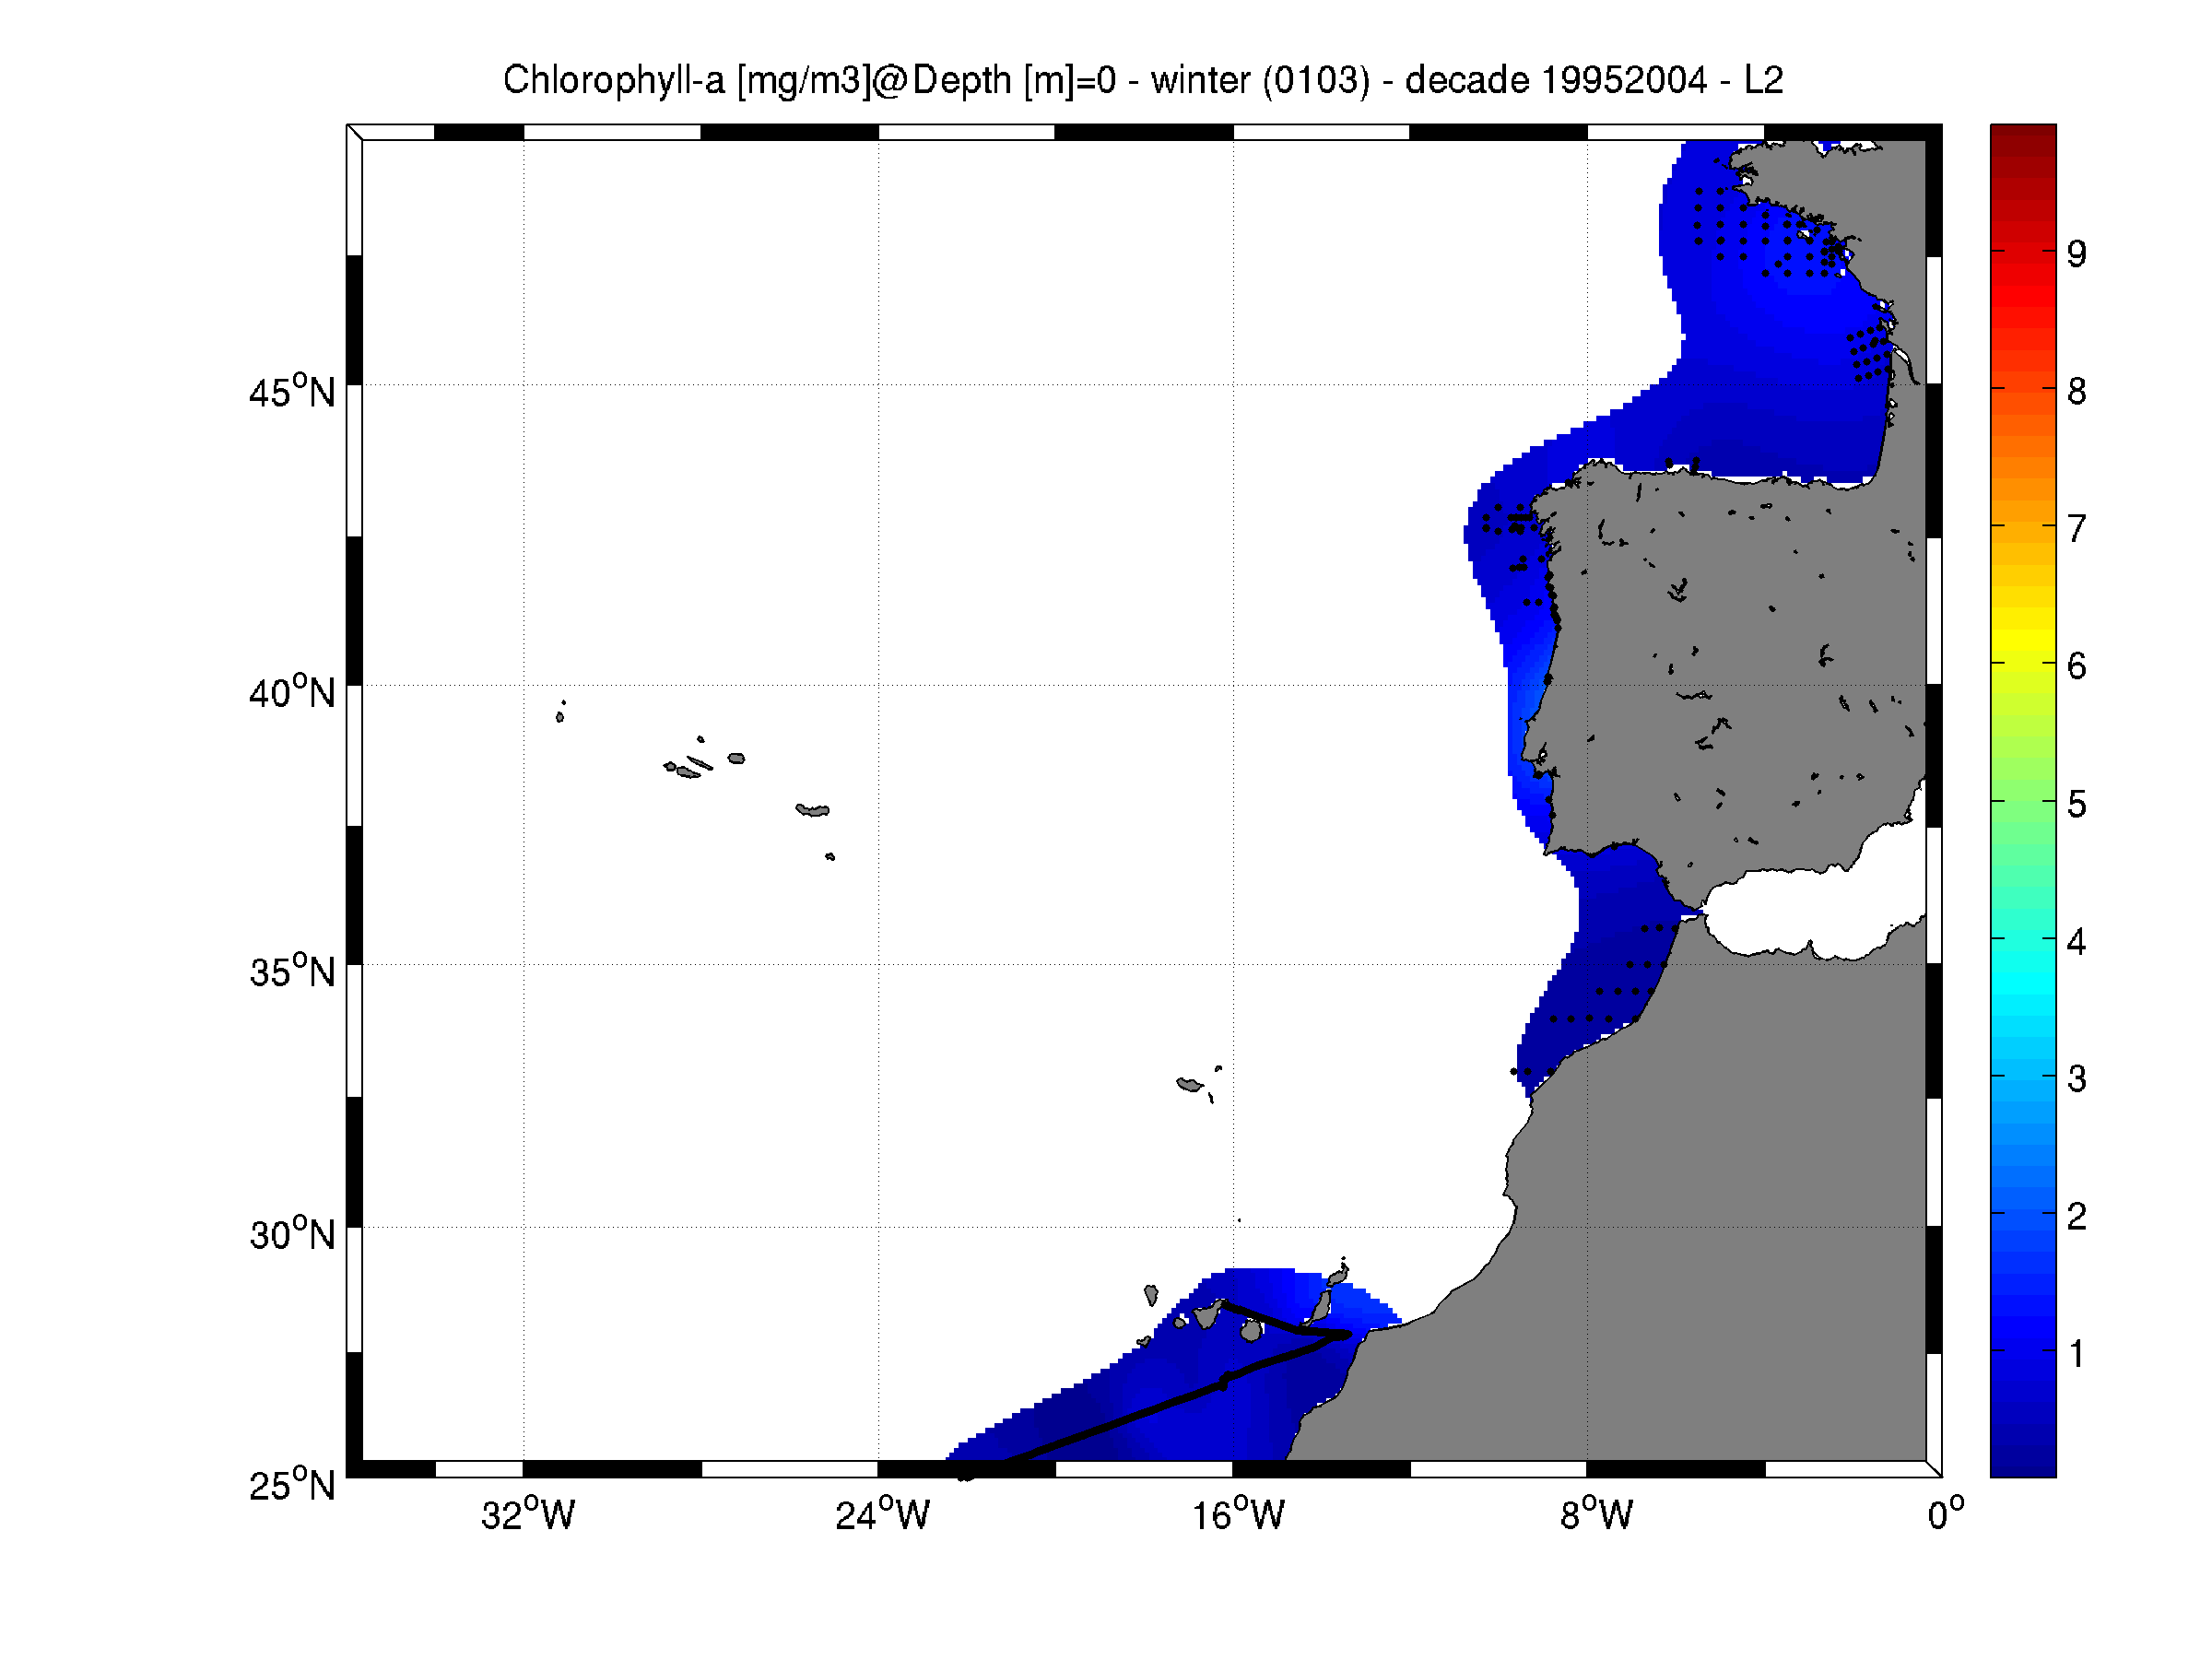
Moving 10-years analysis of Chlorophyll-a -1.0-ANA at Northeast Atlantic Ocean for each season: - winter: January-March, - spring: April-June, - summer: July-September, - autumn: October-December. Every year of the time dimension corresponds to the 10-year centred average of each season. Decades span from 1985-1994 until 2005-2014. Observational data span from 1970 to 2015. Depth range (IODE standard depths): -300.0, -250.0, -200.0, -150.0, -125.0, -100.0, -75.0, -50.0,-40.0, -30.0, -20.0, -10.0, -5.0, -0.0 Data Sources: observational data from SeaDataNet/EMODNet Chemistry Data Network. Description of DIVA analysis: Geostatistical data analysis by DIVA (Data-Interpolating Variational Analysis) tool. GEBCO 1min topography is used for the contouring preparation. Analyzed filed masked using relative error threshold 0.3 and 0.5 DIVA settings. Signal to noise ratio and correlation length were optimized and filtered vertically and a seasonally-averaged profile was used. Logarithmic transformation applied to the data prior to the analysis. Background field: the data mean value is subtracted from the data. Detrending of data: no, Advection constraint applied: no. Units: mg/m^3
-
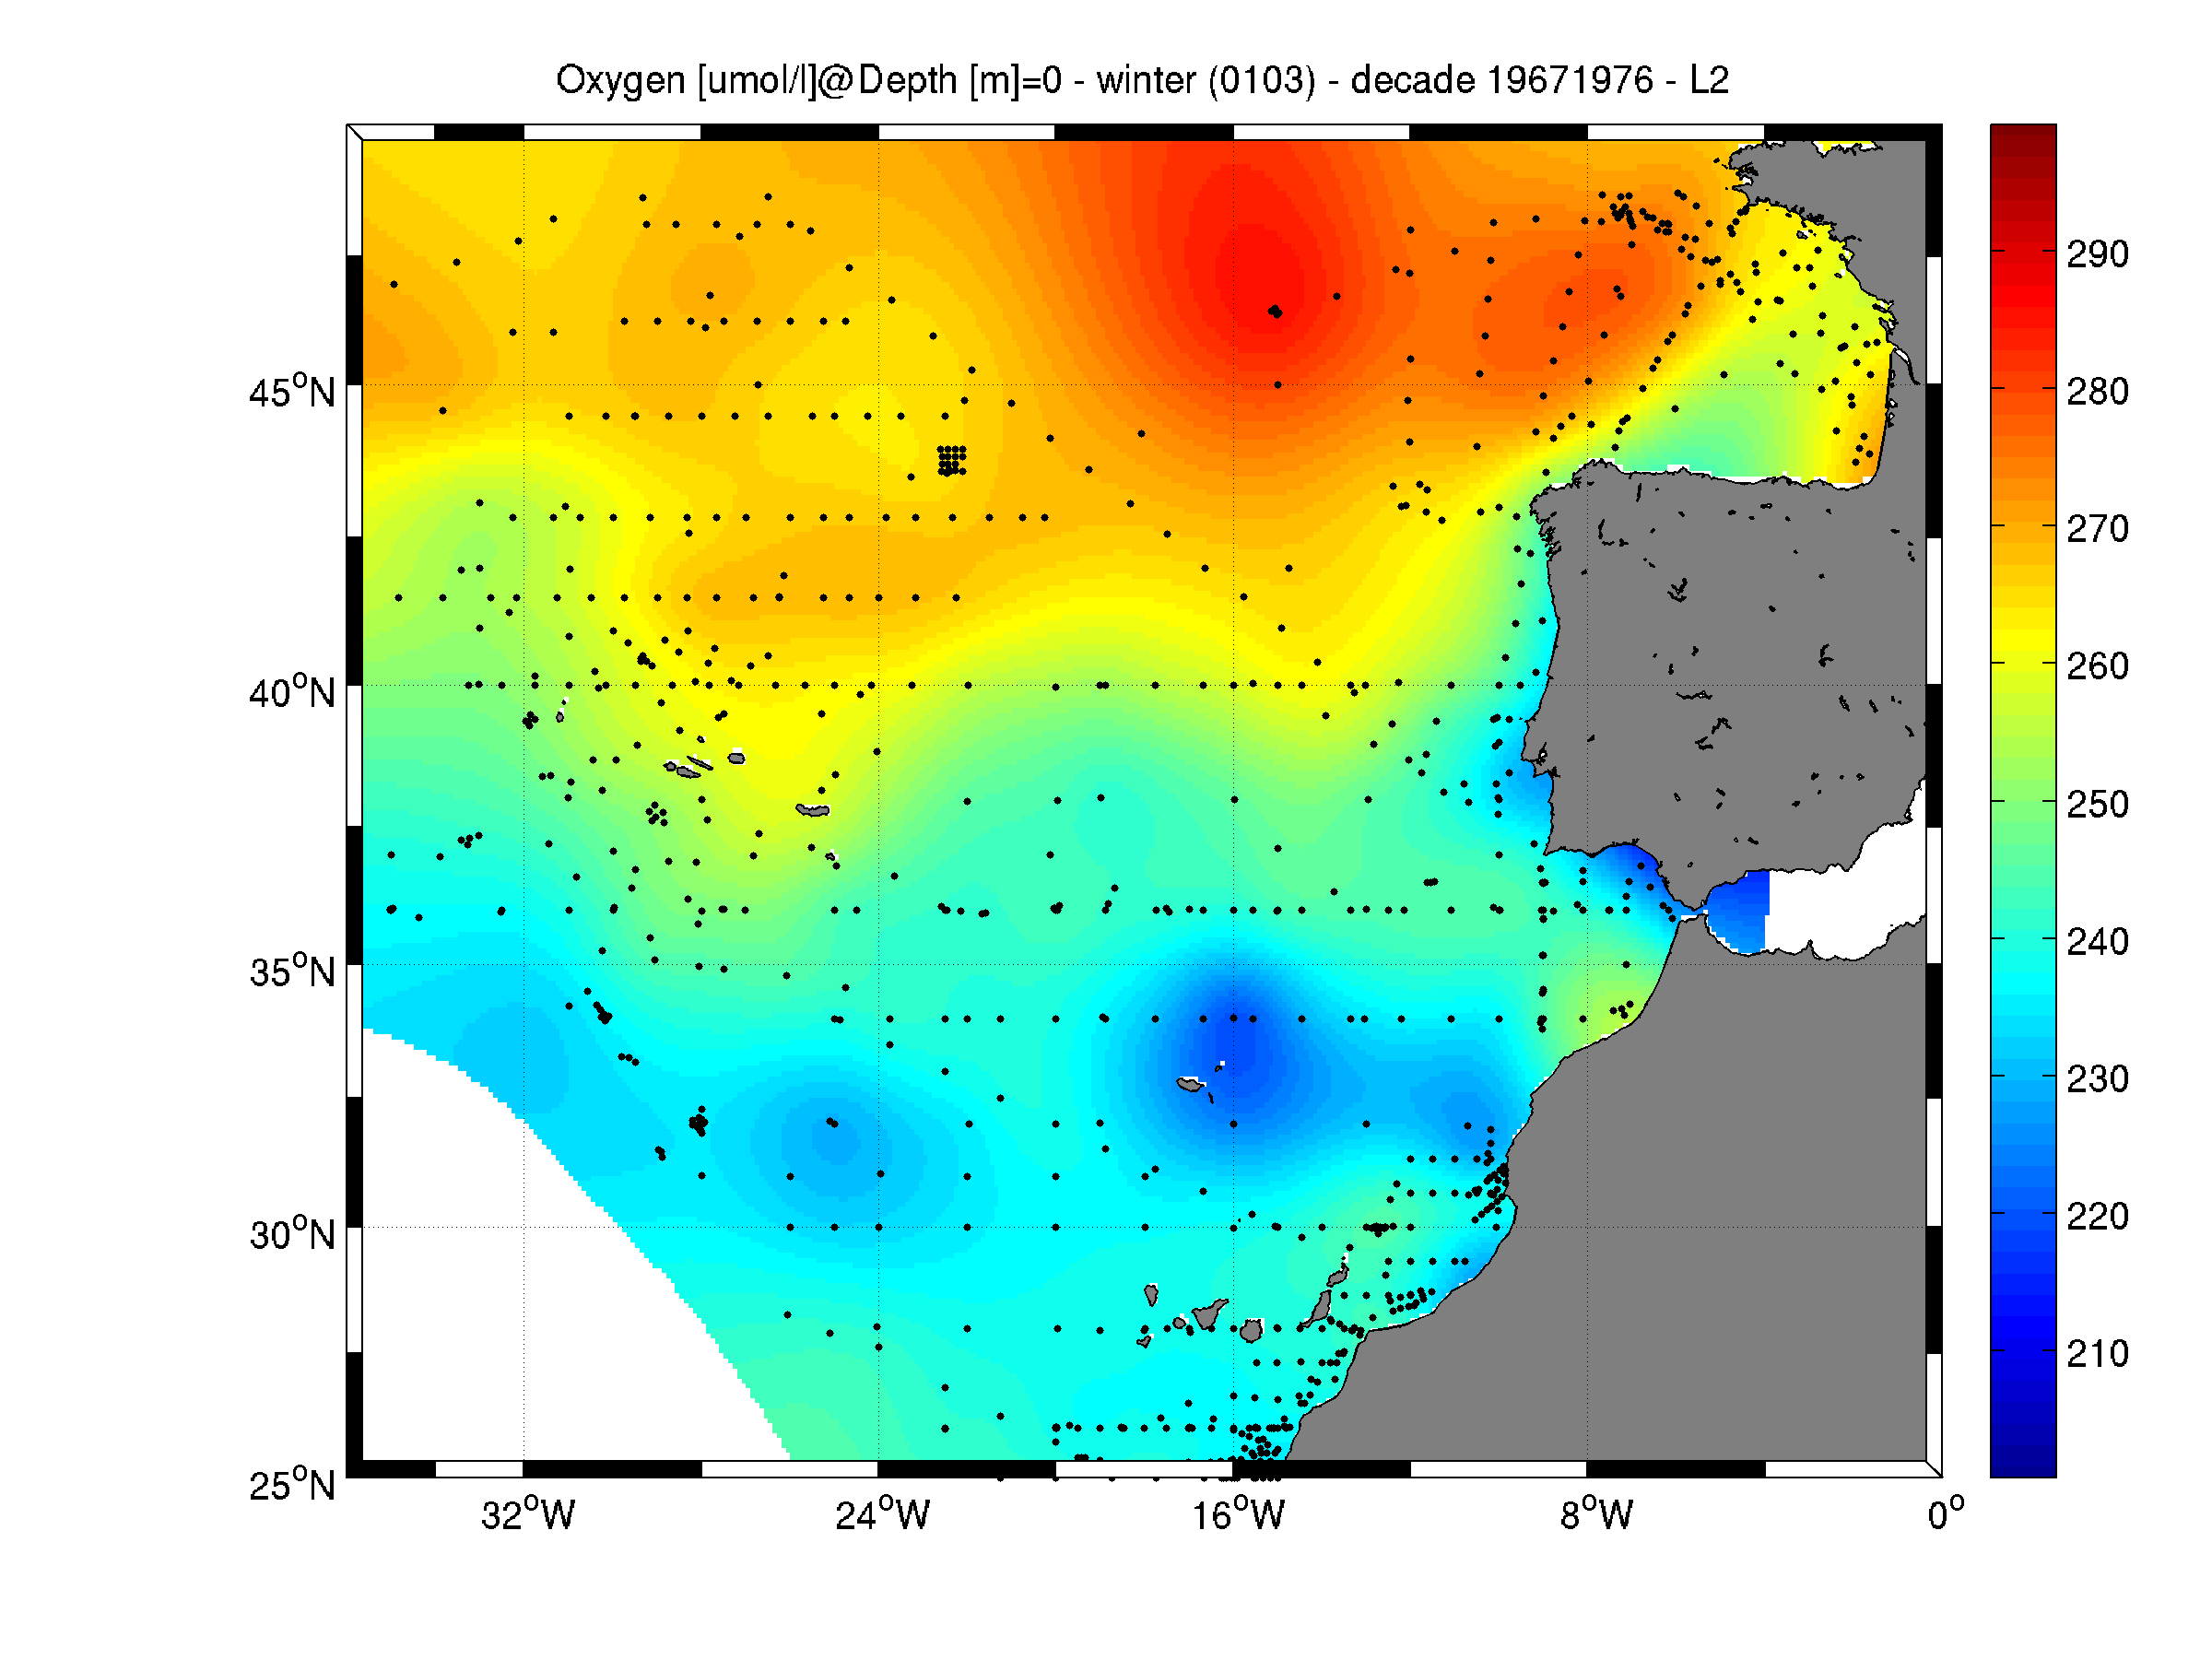
Moving 10-years analysis of Oxygen at Northeast Atlantic Ocean for each season: - winter: January-March, - spring: April-June, - summer: July-September, - autumn: October-December. Every year of the time dimension corresponds to the 10-year centred average of each season. Decades span from 1963-1972 until 2005-2014. Observational data span from 1963 to 2014. Depth range (IODE standard depths): -3000.0, -2500.0, -2000.0, -1750, -1500.0, -1400.0, -1300.0, -1200.0, -1100.0, -1000.0, -900.0, -800.0, -700.0, -600.0, -500.0, -400.0, -300.0, -250.0, -200.0, -150.0, -125.0, -100.0, -75.0, -50.0,-40.0, -30.0, -20.0, -10.0, -5.0, -0.0 Data Sources: observational data from SeaDataNet/EMODNet Chemistry Data Network. Description of DIVA analysis: Geostatistical data analysis by DIVA (Data-Interpolating Variational Analysis) tool. GEBCO 1min topography is used for the contouring preparation. Analyzed filed masked using relative error threshold 0.3 and 0.5 DIVA settings. Signal to noise ratio and correlation length were optimized and filtered vertically and a seasonally-averaged profile was used. Background field: the data mean value is subtracted from the data. Detrending of data: no, Advection consraint applied: no. Units: umol/l
-
Combined product of Water body ammonium based on DIVA 4D 10-year analysis on five regions : Northeast Atlantic Ocean, North Sea, Baltic Sea, Black Sea, Mediterranean Sea. The boundaries and overlapping zones between these five regions were filtered to avoid any unrealistic spatial discontinuities. This combined Water body ammonium product is masked using the relative error threshold 0.5. Units: umol/l.
-
Combined product of Water body phosphate based on DIVA 4D 10-year analysis on five regions : Northeast Atlantic Ocean, North Sea, Baltic Sea, Black Sea, Mediterranean Sea. The boundaries and overlapping zones between these five regions were filtered to avoid any unrealistic spatial discontinuities. This combined water body phosphate product is masked using the relative error threshold 0.5. Units: umol/l
-
Combined product of Water body silicate based on DIVA 4D 10-year analysis on five regions : Northeast Atlantic Ocean, North Sea, Baltic Sea, Black Sea, Mediterranean Sea. The boundaries and overlapping zones between these five regions were filtered to avoid any unrealistic spatial discontinuities. This combined water body silicate product is masked using the relative error threshold 0.5. Units: umol/l
-
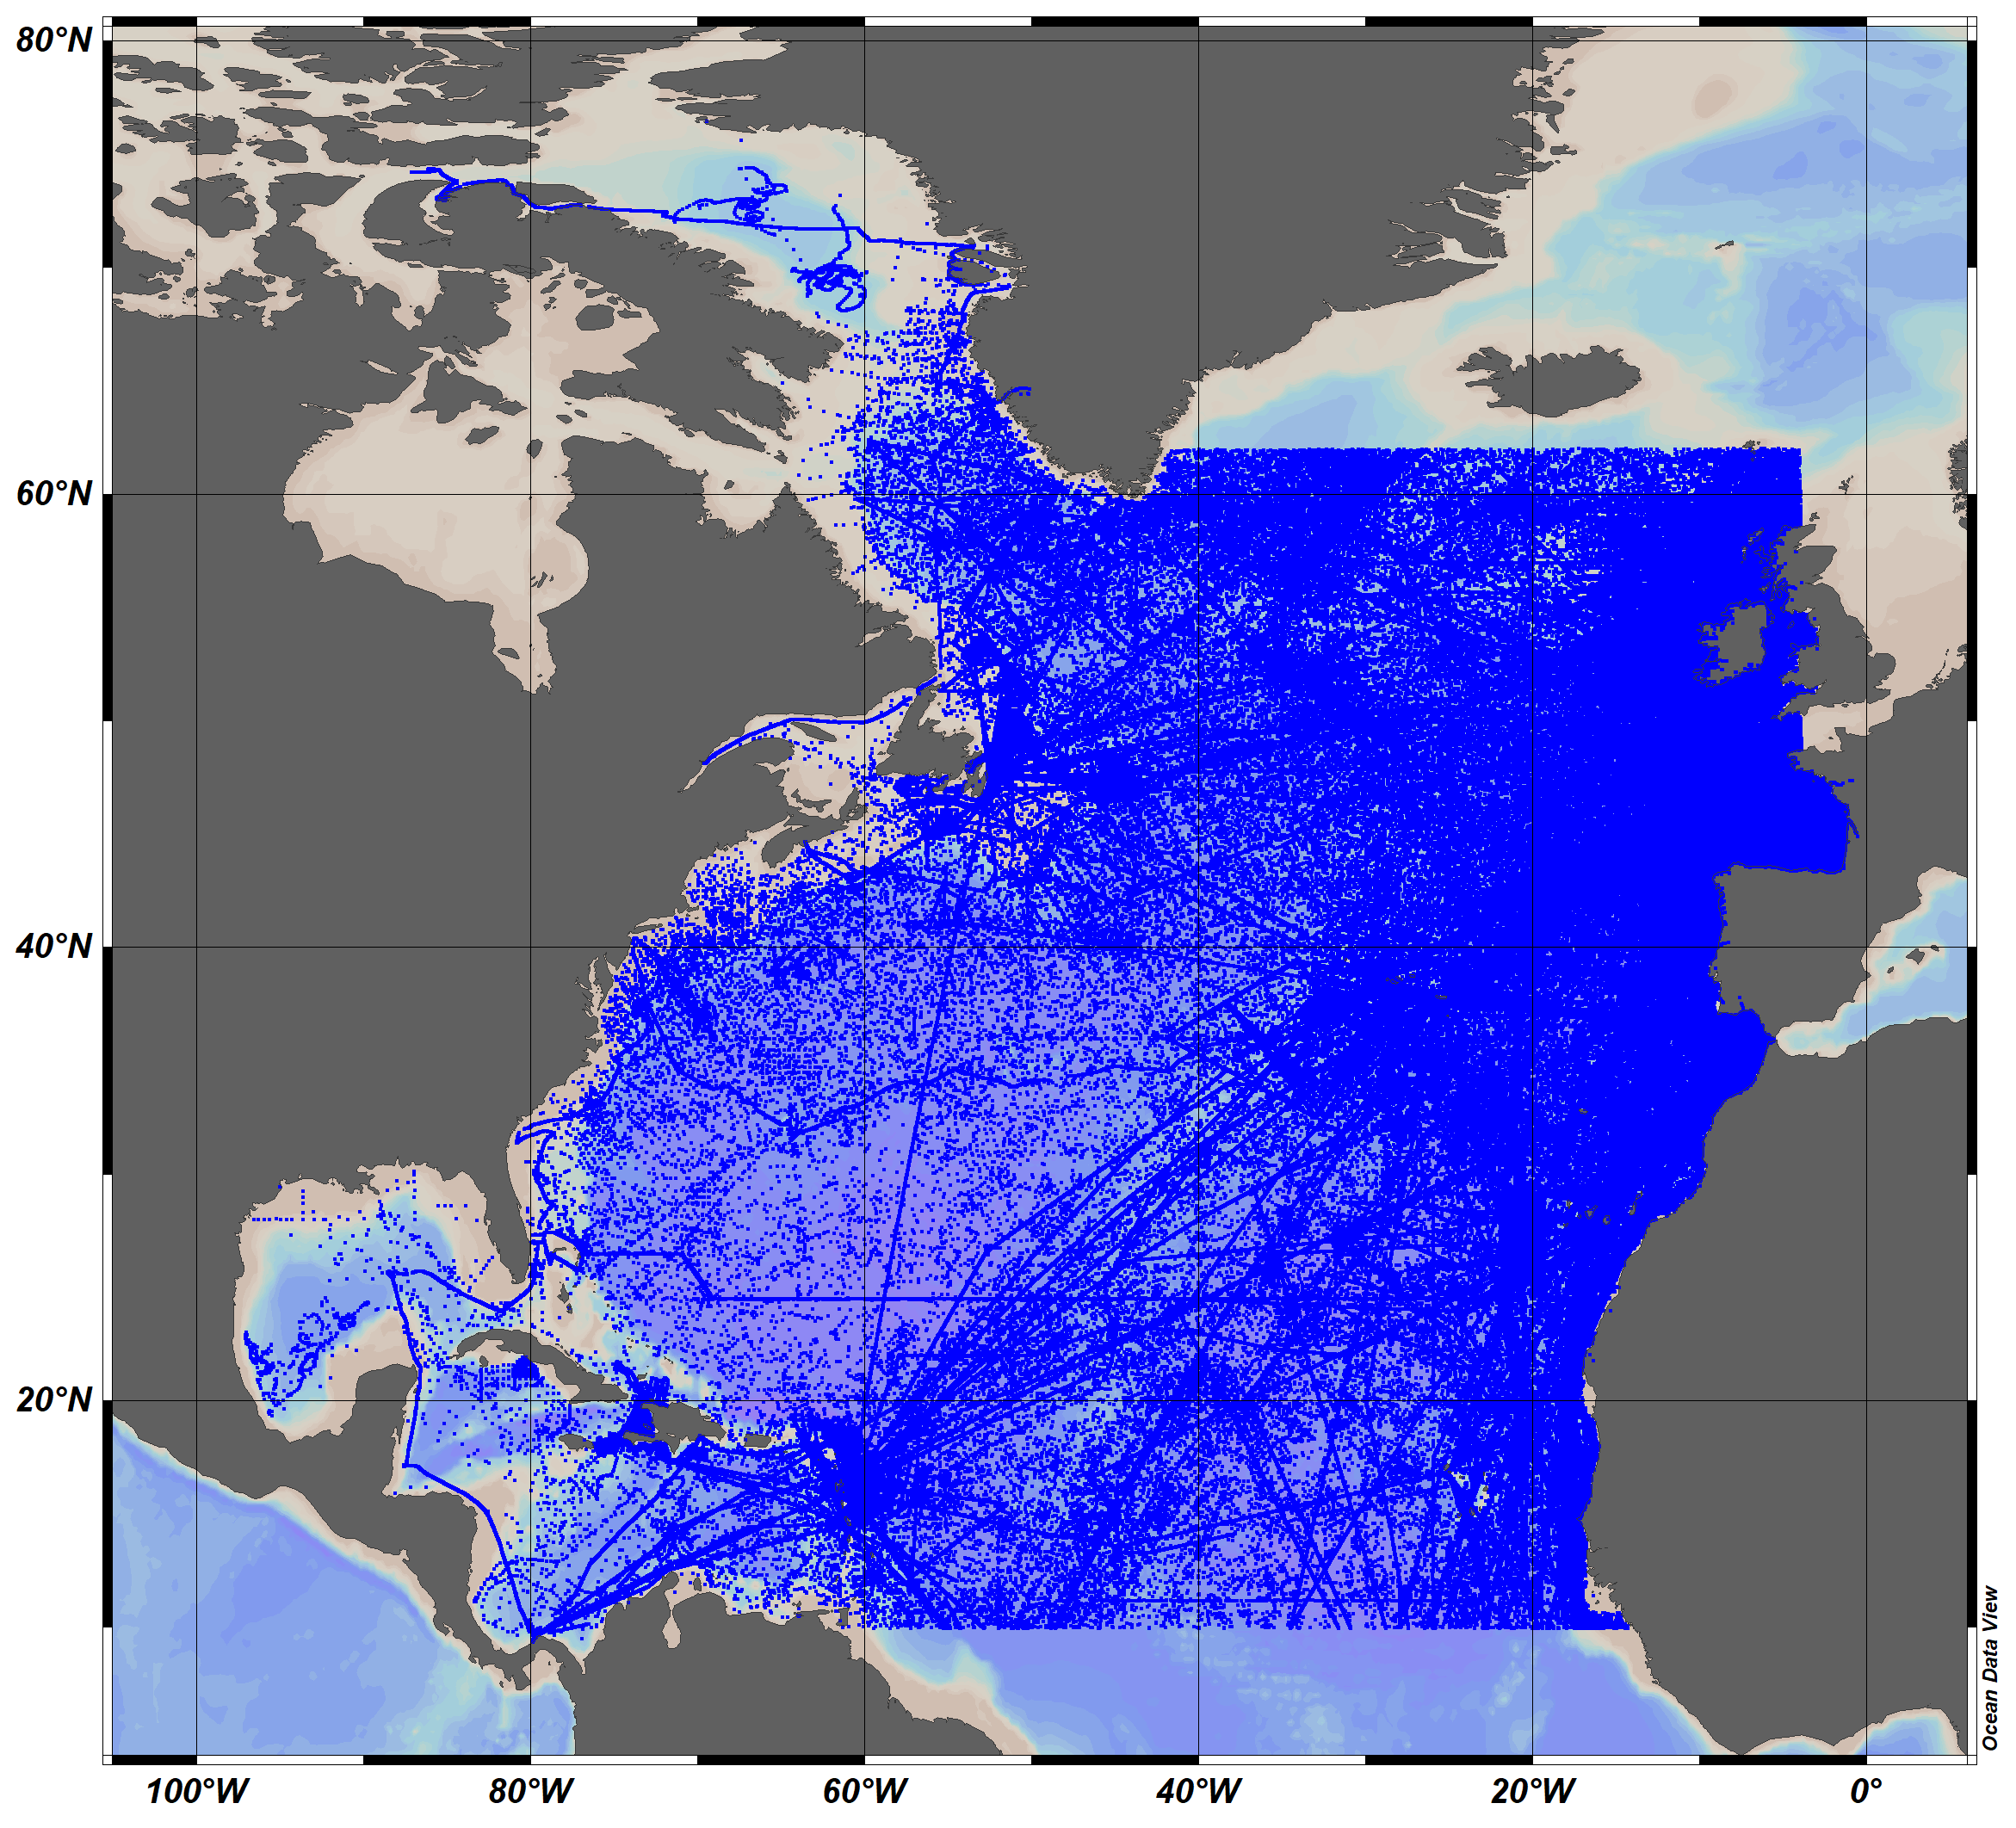
The SeaDataCloud TS historical data collection V2 for the North Atlantic Ocean, includes open access in situ data on temperature and salinity of water column in the North Atlantic Ocean from 10°N to 62°N, including the Labrador Sea, The data were retrieved from the SeaDataNet infrastructure at summer 2019. The dataset format is Ocean Data View (ODV - http://odv.awi.de/) binary collection. The quality control of the data has been performed with the help of ODV software. Data Quality Flags have been revised and set up using the elaborated by SeaDataNet2 project QC procedures in conjunction with the visual expert check. The final number of the Temperature and Salinity profiles (stations) in the collection is 10119755. For data access please register at http://www.marine-id.org/.